Daily Market Analysis from ForexMart

NZD/USD Technical Analysis: May 5, 2017

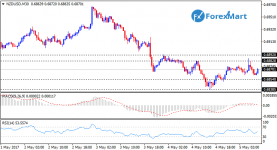
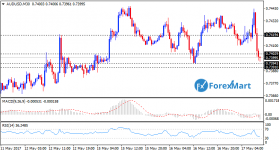
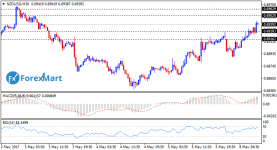
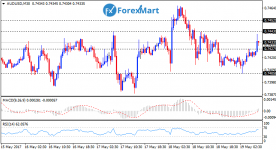
The New Zealand dollar dropped during the Thursday session. The market has gone bearish because of the commodity market and the jobs data to be released. Traders should not forget that the price trend for the kiwi dollar would be influenced by the commodity market. The current trend could go higher reaching the 0.68 handle and short-term surge would mean selling opportunity. If the price breaks lower than the psychological level, the price would go downward instead. Traders should anticipate high volatility in the market but would be favorable for the U.S. dollar since the awaited jobs data to be released today.

The Future market also influences the currency although would not be directly influenced with any market. One could find a correlation between milk futures and the kiwi although it would not do much since the liquidity isn’t that high. The safe way is to compare with other commodities to determine how this currency will move and its overall tone in the market and wait for a short-term surge. It is possible to reverse the trend when it breaks higher than the 0.69 level and turn bullish as a follow through and climb higher.
 

Attachments

  • NZDUSD.png
    NZDUSD.png
    22.1 KB · Views: 57
USD/JPY Technical Analysis: May 5, 2017

The U.S. dollar against the Japanese yen had a high volatility during the Thursday session. The market tried to break higher than the 113 level but failed that makes it much safer to be patient and wait on the sidelines until the jobs data has been released. Moreover, the bullish tone will persist in the long term.

There is a significant support found close to 112.50 level which may be better to move upward although this will be unexpected. The 112 region will be massively supportive but it still might shift when the jobs data results is negative. The labor report is anticipated to give 185,000 jobs for the month of April which the market in now focused on.

It is most likely that this pair will be influenced by the jobs data and if the results are positive, the pair will follow through.if the price breaks higher than the 112 level will be a relevant move while a break at 113 level could further bring the price at 115 level which is the former peak that is in consolidation. More noise in the trend would also impact the trend and make it more difficult to trade during the day. If traders would sway with the ongoing volatility, there is a chance for long term trades. Traders could buy the pair multiple time as it moves towards the 115 handle.

There is not much pressure anymore for the USD/JPY pair as its reach new weekly top during the Thursday session. The uptrend halted at 112.75 which is the psychological level for yesterday and the following morning. Buyers tried to test the 113.00 level prior to the New York opening. The resistance level resides at 113.00 level while the support is found at 112.00 region. The 4-hour charts are showing positive signs. If the bulls were able to break higher than the 113.00 level in the next sessions, the next possible target would be at 113.50 level.
 
NZD/USD Technical Analysis: May 8, 2017

The New Zealand dollar against the U.S. dollar initially rallied for the past week. The 0.69 level was seen to give significant resistance which hints the possible continuation of the uptrend. However, this is not a good indication for commodities which highly influences the currency. On a good side, the crude oil surge for a while during the Friday session. Yet, the commodity market could remain subdued which would then decreased the demand for kiwi. It won’t take long that this pair would further decline. If the pair breakdown lower than the 0.6850 level, the next level would be at 0.67.

Short-term rallies for this pair opens more opportunities which will soon push forward. The pair hovers at 50% Fibonacci retracement level and it is anticipated to have a lot of noise down beloW. However, if the pair breaks down from the expected level, this implies that the pair is not strong enough.

On the other hand, if the pair breaks more than the 0.7030 level, the price could extend up to 0.73 handle or higher. The pair is much more directed to the go downward instead. Traders should look out for commodity market which will influence the currency in the next trading sessions and it may be difficult to go long for long-term in this pair.
 

Attachments

  • NZDUSD08.png
    NZDUSD08.png
    23.2 KB · Views: 56
GBP/JPY Technical Analysis: May 10, 2017

The British pound paired with the Japanese yen rallied during the Tuesday session. The market reached the 147.50 level and tries to reach the 148 handle. There is still a lot of space to climb higher towards the next target of 150 handle. Later on, the 147 level could become a support level.

Amongst a basket of currencies, the Japanese yen sells off the most and sensitive to risk appetite as a whole. Traders should not forget the pair to be volatile and long-term deals is predominant in traders.

The market should also monitor the stock market which is performing well relative to indices such as the S&P 500. Although, traders should expect volatility as it climbs higher and it seems that there is sufficient buying pressure to push the price higher. Nevertheless, reversals open opportunities to gain for this pair, especially for yen related market. It may not be advisable to sell this for now with buyers leading the market. There is still risk appetite which could induce the pair to further go up.
 

Attachments

  • GBPJPY10.png
    GBPJPY10.png
    21.9 KB · Views: 59
USD/JPY Technical Analysis: May 10, 2017

The U.S. dollar against the Japanese yen rallied as it broke at 114 handle. This would most likely move higher towards the 115 level which has been the peak of the last consolidation region and it would not take that long before the market reaches it. It is anticipated for a reversal to occur from now and then which will serve as buying opportunities in the market, most especially that there is a tone of bullishness seen in the trend. Volatility fluctuations is also expected that determines the weakness of the yen.

Price reversals could turn into an opportunity for this pair especially since the Japanese yen performs well in the market. Although, It may not be favorable to go short in this pair. The 113.30 region is being strongly supportive but there is a lesser possibility to go low to this level. It wouldn’t take long for buyers to return.

If the price breaks higher than the 115 level, this could move towards 118 handle. Although, it needs more momentum from the traders to reach this level. Hence, it may not be good to sell this pair for now.
 
USD/CAD Technical Analysis: May 10, 2017

The U.S. dollar paired against the Canadian dollar started flat during the Tuesday session as the oil market being calm but not too long. It was reversed and directed downwards. Another factor is the Canadian building permits that brought movement following its negative reports.

On the other hand, the U.S. dollar surged against the Canadian dollar as it breaks over the 1.37 level. The Resistance level was retested at 1.37 region and the 1.3750 level is being strongly resistive that prevents the pair to climb higher. The market has been very bullish for a long term and it won’t take long before the market reaches the 1.38 handle. A few days ago, there has been a selloff of this pair and if this occurs again, the pair could further go up.

The pair will continue its downtrend from 1.3793 and the uptrend from 1.3641 is a form of consolidation in the downtrend. This could be followed by consolidation towards the next target of 1.3550 level. A break over the 1.3793 region could trigger the price to go up towards 1.3900.

Reversals could attract buyers in the lower channel especially towards the 1.37 handle which has been a resistance before. It is possible for this level to turn into support region for the pair. The long-term trend becomes bullish although the oil market has uncertainty.

The crude oil inventories are about to be released to say which would most likely affect the trend. Reversals could serve as buying opportunities for this pair although the greenback is more favored over the Canadian dollar. Concerns in Canadian housing would add more hesitancy to the interest of the market to Loonie.
 

Attachments

  • USDCAD10.png
    USDCAD10.png
    24.1 KB · Views: 46
EUR/USD Fundamental Analysis: May 11, 2017

The EUR/USD pair continues to exhibit an intermittent trading action, which has been the pair’s dominant price trend ever since the beginning of this week. The market had initially expected the currency pair to start off this week with a bang and consistently exhibit a positive trading stance throughout the week due to Macron’s recent victory in the French polls, but as of now the currency pair is on the backfoot as its bulls have decided to retreat and take out profits in order for them to purchase the EUR/USD pair lower as it continues its correction.

In addition to the EUR/USD pair’s weakness, the greenback has also been strengthening across the board as traders are now about to conclude their June rate hike pricing. All of these factors has caused the EUR/USD pair to exhibit corrections at under 1.0900 points. However, during the past two days, the currency pair has been either ranging and consolidating or exhibiting a choppy price action, which is an indication that the market is attempting to create its own base. The currency pair is expected to create a base for another bullish attempt as the after-effects of the most recent rate hike is now losing its relevance and the improvements in the EU economy is now starting to become more evident in the market.

For today’s session, there are no major news releases from the EU although the US economy will be releasing its unemployment claims and PPI data, although these are not expected to make a significant dent in the current status of the currency pair. The EUR/USD pair can be safely expected to remain its choppy action at the 1.0850 trading range throughout the day.
 
AUD/USD Technical Analysis: May 12, 2017

The Australian currency showed some interesting trading session and had an initial downturn corresponding with the actions of the New Zealand dollar. A bit of rally had started as we look forward to found further resistance within the 0.7380 handle.

The Aussie appeared to be caught off guard as of the moment because of the rally occurred in the gold markets along with the partial decline of the US dollar.

In case that the precious metal would reverse and drop, the AUD will continue to weaken as well.

The commodity currencies may not be so attractive at this time since some of them are quite falling considering the CAD and NZD to have a softer stance while the Norwegian Krona also appeared to be dull. Not to mention the Mexican peso which starts to be weak again.

In order to initiate the selling, exhaustion and near-term rallies are to be found that may allow for a successful break above the region 0.7425.

Moreover, the volatility would extend that will offer value for the greens in which seems favorable for us. In case that we create a gap under the lows once again, the market is projected to move near the 0.72 handle, en route 0.70.
 
USD/CAD Technical Analysis: May 15, 2017

The USD/CAD moves like from pillar to post last Friday and continuously grinding above 1.37 handle. Meanwhile, the oil markets appeared to be disorganized as of the moment. We are directly standing above the channel while a pullback is inessential, however, when this price movement occurred then a move to the lower area would likely follow. Possibly down to the region 1.35 and moving through the mark 1.3250. Contrarily, a break over the channel, particularly in the 1.38 handle, will cause the market to trail atop of the level 1.40. Mainly, the oil markets should be given much consideration as it extensively weighs to the Canadian dollar.

Moreover, the commodity-linked pair is expected to be choppy but it looks like that the oil is in action at this time. The housing market in Canada shows some uncertainties while concerns may arise since the history of the US housing bubble were still remembered clearly by many traders.

The markets should consider sustaining a volatile session, however, the general uptrend will continue to drive through the upside in the longer-term. It further allows the longer-term and steady traders to acquire gains on top of the 1.40 range.

It is recommended to seek for pullbacks which provide value upon getting the chance as the greenbacks continued to be favored by the North American currency.
 

Attachments

  • USDCAD15.png
    USDCAD15.png
    23.6 KB · Views: 60
GBP/USD Technical Analysis: May 15, 2017

The Cable decline within the week as it tested the bottom of the hammer in the past week. The range 1.2950 appeared to be resistive, moving near the 1.3 region. A break over the mentioned level will push the market around 1.3450, wherein a previous resistance was seen.
A cut through in that area would likely be bullish, however, there is a significant level of support found at 1.2750 range.

To be honest, it will be a tedious job to grind below just like breaking upwards. The short-term trading could possibly the simplest thing to accomplish since the market has high possibility to consolidate amid the two regions.

A move in the long-term is anticipated and a needs to break out within area to execute the trade. Meanwhile, a range bound short term is predicted as it will remain to take notice.
Moreover, a breakdown underneath 1.2750 will cause the market to continue to slide.

A significant amount of support can be found below, however, it would appear like the longer term downtrend resumption.

The British currency is currently surrounded by lots of dynamic strains, hence expect for a complex trend over here. In light of this, we decided to allow the market to take an action deliberately.
 
EUR/USD Technical Analysis: May 15, 2017

The EURUSD edged upwards amid Friday sessions as it cleared up the top of Wednesday and Thursday candles followed by the release of the less than stellar figures of United States. In light of this, the market would likely touch above the 1.10 region which the resistance.

A gap over the mentioned area indicates a bullish tone, probably moving towards the 1.13 range trailing to 1.15 eventually.

The market consolidated in the midst of 1.05 and 1.15 levels in the past years. We are currently located in middle of the trading range which is close to the “fair value” which results for a complex trading setting in the near future.

The back and forth trading in the near-term is highly anticipated for the next few sessions. While short-term charts will also lead forward since consolidation is required in the overall region.

A gap overhead the 1.10 area will trigger further purchasing interest. However, a break below the 1.0750 mark will drove to 1.05 handle.

The market is projected to be very volatile and uneasy to trade, mainly because of the concerns that the European Union are currently involved with the United Kingdom together with other nations.

Despite the results, it is vital to maintain your stop loss take, and take note that the market is somewhat aimless in the long-term.
 

Attachments

  • EURUSD15.png
    EURUSD15.png
    22 KB · Views: 22
USD/JPY Fundamental Analysis: May 16, 2017

The USD/JPY pair experienced a turnaround during yesterday’s trading session after a sudden high demand for high-risk assets manifested during the earlier parts of the Monday session. The JPY was initially boosted by flight-to-safety buys but immediately disappeared as market investors chose to shift their focus to the surge in US equity markets. The USD/JPY pair closed down yesterday’s session at 113.787 points after increasing by +0.41% or 0.464 points.

Investors were generally worried with regards to Trump’s unexpected firing of FBI Director James Comey, the cyber-attack which made headlines last Friday, and the ballistic missile launch from the DPRK. The currency pair then began to hit rock-bottom after traders were practically unresponsive to these recent developments. This price action from the USD/JPY shows that investors might have become somewhat oblivious to these said developments. In fact, the cyber-attack was able to benefit the market after tech giants such as Cisco posted gains following the said online attacks.

For today’s trading session, investors will be waiting for the release of industrial production data, mortgage delinquencies data, building permits, capacity utilization data, and housing starts data from the US economy. If this specific set of data comes out as a market disappointment, then the chance of the Fed implementing more rate hikes in the future might be lessened, although the June rate hike has been pretty much priced in by the market already. In any case, this could also cause the US dollar to drop further in value.
 

Attachments

  • USDJPY16.png
    USDJPY16.png
    26.7 KB · Views: 20
EUR/USD Technical Analysis: May 17, 2017

The EURUSD raise higher because of the support of a strong growth and below-than-expected data in the housing number of the United States which brought an impact towards the U.S Treasury yields, hence placing a downward pressure to the American dollar. The sales of US chain stores keep worsening that caused for the greens to move lower.

The Europe started to gain more confidence with hopes that the European Central Bank is going to remove the quantitative easing.

The pair climbed upwards reaching 0.9% near the mark 1.1080. The price was cut into the downtrend sloping line moving close to the support region 1.0990.

Further support is found alongside the 10-day moving average approaching the 1.0940 level. The target resistance can be spotted at 1.1299 touching its November peaks. Moreover, the momentum was positive since the moving average convergence divergence (MACD) histogram formed a crossover signal to buy. This is the result of the spread that crossed over the 9-day EMA of the spread.

The histogram shifted from negative to positive area indicating a buy signal. It also printed in the black along with an upward sloping trajectory and turns to a higher rate.
 

Attachments

  • EURUSD17.png
    EURUSD17.png
    20.6 KB · Views: 24
GBP/USD Fundamental Analysis: May 17, 2017

The sterling pound’s bulls experienced a very harrowing trading day yesterday after the GBP/USD pair was unable to make any significant progress even after all the other major currency pairs were able to take advantage of the greenback going on backfoot. The cable pair remained within a very limited trading range and was unable to even advance towards its range highs, much less surpass this particular range. Several geopolitical issues has caused the dollar to drop, however, the GBP/USD pair did not have enough fuel for it to actually gain from the dollar losses.

The US housing data fell short of initial market expectations, and this proved to be somewhat damaging for the interest rate bulls who had already priced in the possibility of a June rate hike from the Fed. However, the market was more affected by news that Trump had apparently leaked top-secret information to the Russian government straight from the Oval Office, in addition to reports that Trump has apparently been caught dipping his fingers into a certain continuing investigation. These series of events triggered a massive dollar selloff, and while other major currencies such as the EUR were able to make use of this particular development, the sterling pound barely moved from its original position. The GBP/USD pair only slightly advanced from 1.2900 points and is now placed at just under 1.2950 points and does not look like it could induce a rally anytime soon. This is an indicator of just how weak the currency pair as of the moment and it could only be a matter of time before things take a turn for the worse.

For today’s trading session, there are no expected releases coming from the UK economy although international geopolitical events could possibly dominate the market for today. However, the GBP/USD pair is not expected to exhibit that much volatility given its recent weakness, and the pair should start a rally soon in order to placate any risk of the pair’s current standing taking a turn for the worse.
 
AUD/USD Technical Analysis: May 17, 2017

The Australian dollar closed higher than the U.S. dollar during Tuesday session. Investors responded to the raising concerns in U.S. with lower U.S. Treasury yields, feeble U.S. housing data and a lesser possibility for a Fed rate hike in June. The overall direction of the pair will depend on the Treasury yields. Traders reacted pessimistically to Westpac Consumer Sentiment dropping up to 1.1.%.

There are no major U.S. economic reports to be released today. Traders continuously keep an eye on problems with Trump regime and they have the chance to react to the most recent weekly inventories data of U.S. Energy Information Administration.

The main trend is directed downward as shown in the daily chart. The pair is trying to move higher from the .7329 low on May 9 although the momentum remains the same. To reverse the trend, traders need to impede the short-retracement zone between .7442 and .7469.
Traders should also look out for the resistance level as a strong resistance region is formed at .7454 with major 50% level. The closest support resides at .7384 key Fibonacci region followed by .7329 down below.

The current price level set at .7419 and stays between the resistance and support levels which means that traders have uncertainty and expected volatility in the market.

If buyers try to oppose the trend, the next psychological would be at .7443 and .7446 region then moves to .7449 and .7454 and will most likely gain momentum at .7454 towards the next target at .7469 level. The .7469 Fibonacci level at .7469 would be the turning point for the next downtrend towards .7501 angle.

Underneath, the initial support target would be at .7389 uptrend angle followed by a major Fibonacci level at .7384 and lastly towards the .7329 as the probable bottom support angle. However, if the market fails to attain this level, there is a high possibility for a breakout at .7359.

Until buyers return in the market and exceed the .7469 level, there will be least resistance and rallies will be fruitful in the market. This will affect the price trend whether it will be reversed or not. Currently, the market gives off a neutral stance.
 

Attachments

  • AUDUSD17.png
    AUDUSD17.png
    24.4 KB · Views: 23
AUD/USD Technical Analysis: May 19, 2017

The Australian currency experienced a volatile session yesterday due to an initial shot higher with gold. But decided to sell off as the market needs for another leg found at the 0.74 handle, the support was found but rebounded.

The market appeared to be slightly mixed-up as of the moment and attempted to estimate the risk of the political uncertainties in Washington DC.

Based on a longer-term perspective, the market needs to maintain a bullish attitude only when the gold markets engage in the rally. It remains to have lots of noise though, a smaller position would be better while the Aussie continued to accelerate.

Meanwhile, charts showed some activity of buying on the dips which could be a good idea in trading in the market.

The level below 0.74 must provide a massive support because a breakdown under this range will generate a negative signal. Consider the potential gap within the upward bias, so it is advisable to hold for small positions on near-term charts generating short-term gains.

In case that we cut through above the mark 0.75, it will favor for a longer-term position. In this point in time, riding the market would let you experience emotional highs and lows.

As indicated in the previous charts and sessions, making money is easy in both directions but the market is currently choppy. It does not offer any signs as of now, causing the participant to endure difficulty in driving the market.
 

Attachments

  • AUDUSD19.png
    AUDUSD19.png
    24.9 KB · Views: 19
GBP/USD Technical Analysis: May 19, 2017

The national currency of Britain climbed higher as the data of retail sales presented stronger figures beating expected result.

The level 1.30 contained some amount of psychological significance. A break out on top of it provides signs of bullishness. With that being said, the market is expected to move higher on a longer-term however the overall place appeared to be complex.

There is a likelihood that the market will trail upwards hitting the region above 1.3450.
The stronger statistics of the retail sales could be linked on some side of inflation because the figures and U.K suddenly gained greater strength.

We could still experience pullbacks occasionally and it should provide buying opportunities intended for longer-term traders.

A huge increase throughout the day indicates a bullish sign while trends could possibly break and when it happen, the market may need to take some time to rest.

The downtrend is over for the GBPUSD however, plenty of noise are needed to beat amidst the current range together with the mark 1.3450 which requires patience and diligence.
 
USD/CAD Fundamental Analysis: May 19, 2017

The USD/CAD pair continues to exhibit a very steady trading manner during the previous session and seems to be largely unaffected by the currently very high volatility levels in the market. In spite of the recent turmoil affecting the US government and a spike in oil prices, the loonie seems to be unaffected by this and remains trading on both sides of 1.3600 points in a very choppy price action with no indications of a possible change in direction.

The recent surge in oil prices has kept the USD/CAD pair buoyant, and this is why the currency pair has stayed within the reach of 1.3550 points. The pair’s consolidation is expected to continue until the next few days since oil prices have already increased in the short-term. Meanwhile, the greenback could possibly backfoot across the board since the possibility of a June Fed rate hike has dimmed somewhat. If this indeed happens, then the 1.3550 range will become a very critical region to surpass and until the USD/CAD pair goes past this range, then it can be safe to say that the pair’s uptick is most likely to remain in the short-term. Otherwise, the currency pair could possibly revert to its previous range and could resort to a bearish consolidating price action.

For today’s session, the Canadian economy will be releasing its CPI data and retail sales data, both of which are expected to induce volatility in the pair’s price action.
 

Attachments

  • USDCAD19.png
    USDCAD19.png
    28 KB · Views: 26
GBP/USD Technical Analysis: May 22, 2017

During the Friday session, the pair GBPUSD remarkably did well since an extreme and rapid price decline occurred on Thursday. While an uptrend is tested, however, a turnaround was carried out promptly.

As the traders calm down, the market eventually break out in the upside hitting the top of the 1.30 region. In the previous trades, a renewed highs were formed and the Britain’s currency would likely look forward through the 1.3450 area that has consolidated in the longer term.

A break on top of the range 1.30 seems significant and the flash crash happened on Thursday still not clear which brought fears to many people. Moreover, the uptrend line amid that sudden drop matters a lot and it appears that the 1.29 mark can be the acting basement of this market.

The choppiness was still expected to continue but the market may indicate a bullish attitude.

The pullback eyes some support within the level 1.30 but a breakout towards a fresh peak would trigger a buying behavior.

The GBP attempted to change its general trend in the upside which could go a long way throughout establishing trend confidence.1

In addition, the uptrend will continue since the moving averages drove to the upside and selling is not an option at all. While a move forward would pave the way for the “buy on the dips”.
 
USD/JPY Technical Analysis: May 22, 2017

The U.S. dollar against the Japanese yen broke in the upper than stabilize the currency pair during the Friday session. This indicates that the market had adjusted with the minimal risk this weekend which is a positive thing.The trading has been strong which is being monitored by traders and they try to bring the price higher than the 112.50 level. Although, as of the moment, the trend is currently in accumulation. If the market could break higher than the 112.50 level would give a bullish tone in the market and would move the price continue to 114 level. This would even go higher when the Federal reserve decided to bring the interest rates higher and this possibility of raising rates caused selling early this week.

The U.S. jobless claims declined which is one of the major directives of Federal reserve that would most likely impede the interest rate hike. Others would want to be dovish or totally forget about it but it is not plausible to do so as the U.S. has eased monetary for the past years and is not exemplifying expected results. On the other hand, the employment is being tight indicating the strengthening of the economy which would bring the interest rates higher as expected.
 

Attachments

  • USDJPY22.png
    USDJPY22.png
    24.9 KB · Views: 22
Back
Top